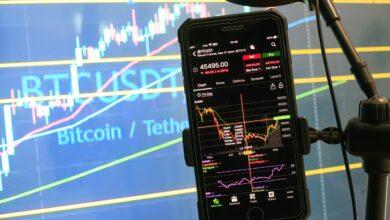
Mastering Crypto – Technical Analysis Unleashed

The world of cryptocurrency trading is an intricate tapestry woven with volatility and opportunity, presenting a unique landscape for investors willing to navigate its complexities. At the heart of successful trading lies the art and science of technical analysis–an indispensable tool that enables traders to decode market behavior through the lens of chart patterns and indicators. By employing this analytical framework, one can gain valuable insights into the price movements of digital assets, allowing for more informed investment decisions.
Utilizing technical analysis in cryptocurrency investment involves a meticulous examination of historical price data, revealing recurring patterns that can forecast potential future movements. These patterns, whether they manifest as head-and-shoulders formations or bullish flags, serve as visual cues that guide traders in their strategic endeavors. With a keen eye for detail, one can harness these graphical representations to identify entry and exit points, thereby optimizing their trading performance.
Moreover, the application of technical indicators further enriches this analytical approach. Tools such as moving averages, Relative Strength Index (RSI), and Bollinger Bands act as additional layers of insight, providing clarity amidst the noise of market fluctuations. By integrating these indicators into their trading strategies, investors can enhance their ability to discern trends and reversals, ultimately leading to more judicious asset management. The dance of numbers on a chart transforms from mere figures into a narrative–a story waiting to be read by those who are prepared to listen.
In essence, the deployment of technical analysis in crypto trading is not merely about numbers; it is about understanding the psychology of market participants and recognizing the rhythm of the market itself. As we delve deeper into this topic, we will explore various chart patterns and indicators that can empower traders to navigate the exhilarating yet treacherous waters of cryptocurrency investment with confidence and precision.
Understanding Technical Analysis Basics in Cryptocurrency Trading
Technical analysis serves as a cornerstone for many investors navigating the tumultuous waters of cryptocurrency trading. At its essence, this methodology examines historical price movements and trading volumes to forecast future asset behavior. Unlike fundamental analysis, which may delve into the underlying value of a digital asset, technical analysis employs charts and various indicators to identify patterns within market data. This approach allows traders to make informed decisions by recognizing trends and potential reversals, thus enhancing their investment strategies.
Applying technical analysis in crypto trading is particularly pertinent given the volatile nature of digital assets. Market participants utilize this analytical framework to gauge the momentum of price movements, enabling them to time their entries and exits with greater precision. For instance, a trader might observe a bullish trend in Bitcoin’s price over a series of days, prompting them to enter a long position. Conversely, if bearish signals emerge, they might decide to liquidate their holdings or even short the asset. This adaptability is crucial in an environment where prices can fluctuate dramatically within moments.
Utilizing chart patterns plays an instrumental role in the realm of cryptocurrency investment. Patterns such as head and shoulders, flags, and triangles provide visual cues that can signal potential market behavior. For example, a well-defined ascending triangle pattern may indicate increasing buyer interest and a possible breakout to higher prices. Conversely, a descending triangle could suggest mounting selling pressure and a potential decline. By recognizing these formations on price charts, traders can better anticipate market movements and adjust their strategies accordingly.
Employing technical indicators further refines the analysis of digital assets. Tools such as moving averages, Relative Strength Index (RSI), and Bollinger Bands serve as invaluable aids in deciphering market conditions. Moving averages smooth out price fluctuations, allowing traders to identify overarching trends more clearly. The RSI provides insights into whether an asset is overbought or oversold, thus signaling potential reversals. By integrating these indicators into their trading strategy, investors can enhance their decision-making process and mitigate risks associated with emotional trading.
Moreover, understanding the interplay between different technical indicators can yield even more robust insights. For example, when the RSI approaches extreme levels while simultaneously diverging from price movements–known as divergence–it may be a strong indication of an impending reversal. Similarly, combining moving averages with volume analysis can highlight significant shifts in market sentiment. Such multifaceted approaches empower traders to create a comprehensive picture of market dynamics and respond proactively to changing conditions.
In conclusion, mastering the basics of technical analysis is essential for anyone serious about cryptocurrency trading. By applying this methodology effectively–through recognizing chart patterns and employing various indicators–traders can navigate the complexities of digital asset investment with greater confidence. As the cryptocurrency landscape continues to evolve, those who engage deeply with technical analysis will likely find themselves better equipped to capitalize on opportunities while managing risks inherent in this rapidly changing market environment.
Key Tools for Technical Analysis in Cryptocurrency Trading
In the ever-evolving realm of cryptocurrency, technical analysis emerges as an indispensable tool for traders seeking to navigate the complexities of digital asset markets. At its core, technical analysis employs historical price data and trading volume to forecast future price movements. By utilizing various indicators and chart patterns, investors can make informed decisions, mitigating risks associated with volatility. The foundation of this approach lies in the understanding that market sentiment is often reflected in price trends, allowing traders to capitalize on behavioral patterns.
Applying technical analysis effectively requires a solid grasp of specific tools that serve as navigational aids in the unpredictable waters of crypto trading. Among these tools, candlestick charts stand out due to their ability to convey significant amounts of information within a single visual representation. Each candlestick encapsulates open, high, low, and close prices over a designated timeframe, providing insights into market momentum and potential reversals. Furthermore, combining these charts with moving averages can enhance understanding by smoothing out price fluctuations and highlighting underlying trends.
Utilizing chart patterns is another crucial aspect of technical analysis that cryptocurrency traders should master. Patterns such as head and shoulders, triangles, and double tops/bottoms provide valuable signals regarding potential price movements. For instance, a bullish inverse head and shoulders pattern may suggest a forthcoming uptrend after a period of decline. Traders who recognize these formations can position themselves advantageously within the market, entering trades at optimal points to maximize their investment returns.
Employing technical indicators significantly enriches the analytical toolkit available to crypto traders. Indicators such as the Relative Strength Index (RSI) and Moving Average Convergence Divergence (MACD) help assess market conditions by quantifying momentum and trend strength. The RSI, for example, ranges from 0 to 100 and indicates whether an asset is overbought or oversold–factors that are crucial for making strategic entry and exit decisions. Similarly, MACD utilizes moving averages to identify potential buy or sell signals based on crossovers.
Moreover, integrating volume analysis into technical frameworks allows investors to gauge the strength behind price movements. High trading volumes accompanying price increases often signify robust buying interest, while diminishing volumes may indicate waning enthusiasm among traders. This interplay between volume and price action serves as a critical layer of verification for those employing technical analysis in their cryptocurrency investment strategies.
In conclusion, mastering technical analysis equips cryptocurrency traders with the necessary skills to navigate the volatile landscape of digital asset trading. Through the diligent application of chart patterns, indicators, and volume analysis, investors can harness the power of data-driven insights to inform their decisions. As the cryptocurrency market continues to mature, those adept at utilizing these analytical tools will likely find themselves better positioned to capitalize on emerging opportunities while mitigating risks inherent in this dynamic environment.
Interpreting Price Charts Effectively
In the realm of cryptocurrency trading, interpreting price charts effectively is paramount for making informed investment decisions. Price charts serve as a visual representation of market trends and movements, allowing traders to analyze historical data and anticipate future price actions. By examining various timeframes–be it hourly, daily, or weekly–traders can discern patterns that reveal potential buying or selling opportunities. For example, a trader might identify an upward trend on a daily chart, suggesting momentum that could be exploited for profit.
Employing Technical Indicators for Digital Asset Trading
To enhance their analysis, traders often employ technical indicators that provide quantitative insights into market behavior. Indicators such as Moving Averages, Relative Strength Index (RSI), and Bollinger Bands are essential tools in a trader’s arsenal. Moving Averages can help smooth out price fluctuations, providing a clearer view of the underlying trend. Meanwhile, RSI offers a glimpse into whether an asset is overbought or oversold, guiding traders on potential reversal points. By combining these indicators with price charts, traders can forge a comprehensive strategy tailored to the unique volatility of cryptocurrencies.
Applying Technical Analysis in Crypto Trading
Applying technical analysis in cryptocurrency trading requires not only knowledge of indicators but also an understanding of market psychology. The crypto market is notoriously volatile, influenced by factors ranging from regulatory news to market sentiment. This volatility necessitates a disciplined approach to technical analysis, where traders must remain objective and avoid emotional decision-making. By establishing clear entry and exit points based on analyzed data, traders can navigate the unpredictable waters of digital asset trading more effectively.
Utilizing Chart Patterns in Cryptocurrency Investment
Chart patterns play a crucial role in the technical analysis framework, offering visual cues about potential market movements. Patterns such as Head and Shoulders, Double Tops, and Flags can signal impending price reversals or continuations. Recognizing these patterns allows traders to make strategic decisions aligned with potential market shifts. For instance, identifying a bullish flag could prompt a trader to enter a position with confidence that the asset will continue its upward trajectory. Ultimately, mastering the interpretation of these patterns is essential for anyone serious about investing in cryptocurrencies, enabling them to capitalize on emerging trends while mitigating risk.
Conclusion: Mastering Technical Analysis in Cryptocurrency Trading
In the ever-evolving landscape of cryptocurrency, the application of technical analysis serves as a beacon for traders navigating the tumultuous waters of digital asset investment. Employing various indicators and chart patterns not only enhances our understanding of market dynamics but also equips us with the tools necessary to make informed decisions in an environment characterized by volatility and uncertainty.
As we delve into the intricacies of crypto trading, it becomes evident that utilizing technical indicators–such as moving averages, RSI, and MACD–can significantly improve our ability to predict price movements and identify potential entry and exit points. These indicators act as a language through which the market communicates its potential future actions, allowing traders to interpret signals amid the noise.
Key Takeaways
- Employing Technical Indicators: The judicious application of technical indicators can transform chaotic price action into discernible trends, paving the way for strategic trading decisions.
- Utilizing Chart Patterns: Recognizing and understanding chart patterns such as head and shoulders or double tops can provide insights into market psychology and potential reversals.
- Analysis for Investment: A robust analytical approach enables traders to mitigate risks and capitalize on opportunities within the digital asset space.
- Continuous Learning: The cryptocurrency market is a living organism; thus, staying abreast of new techniques and refining one’s analysis skills is paramount for sustained success.
Ultimately, applying technical analysis in cryptocurrency trading is not merely about numbers and charts–it’s about cultivating a deep appreciation for the art of market interpretation. By embracing this analytical framework, traders can navigate the complexities of digital asset investment with confidence and clarity, transforming uncertainty into opportunity. Let your journey in crypto trading be guided by knowledge, curiosity, and a passion for discovery.


